Data visualisation
Feature List
- View spectrum
- Generate image
- Customise image display
- Generate images from list
- Save image list
- Generate RGB composite
- View spectrum
- Overlay spectra
Interface Overview
The interface has changed appearance in the latest version, but the information on this page is still accurate.
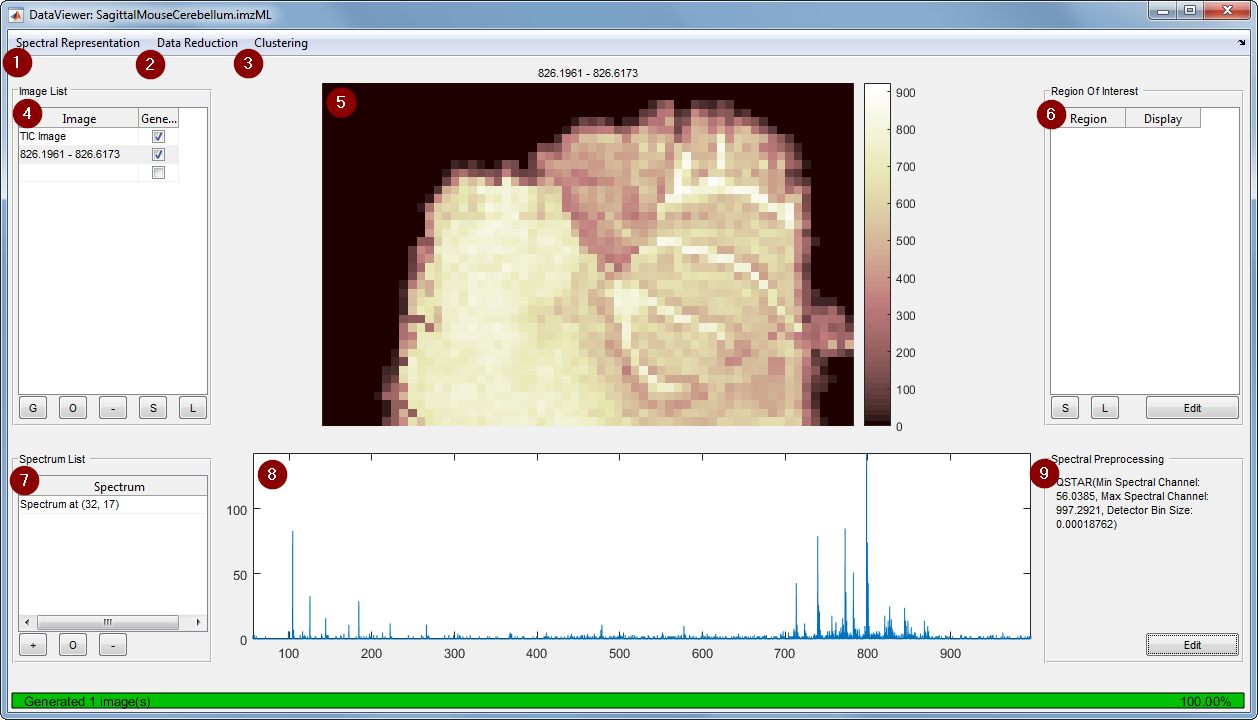
- Generate a spectral representation
- Perform data reduction
- Perform clustering
- Image List panel
- Selected image display
- Region of Interest panel
- Spectrum List panel
- Selected spectrum display
- Spectral Preprocessing panel
View Spectrum
To view the spectrum associated with a single pixel, simply click on the desired pixel and the spectrum will be displayed in the spectrum display panel.
- Zooming into a spectrum is performed by click-and-drag below the spectrum axis (see below)
- Zooming out is performed by double clicking below the spectrum axis
Image Generation
This section is written to describe generation of images in mass spectrometry imaging (i.e. ion images, where the spectral channels are m/z values), but the same process applies for any spectral imaging data.
Generation of ion images is performed by selecting one or more m/z limit pairs
Ion images that have been previously generated are marked by a tick (✓) in the ‘Generated’ column in the Image List panel.
When a dataset is loaded as ‘Data On Disk’, ion images are not automatically generated. As the generation of 10, 20, or even 100 ion images takes approximately the same amount of time when data is on disk, the generation process is only triggered when the user clicks the G button in the Image List panel. Once this button is clicked, all images that have not been previously generated (which do not have a tick (✓) next to them) in the image list will be generated.
Various methods of generation ion images are discussed in the following sections.
Visually select ion image limits
Select the range by clicking and dragging above the axis in the spectrum.
Manually select ion image limits
- Type the range manually into the
Image List, with the minimum and maximum value separated by a hypen (-). - Type a centroid value only into the
Image List. When the images are generated, SpectralAnalysis will then automatically apply the range (+/-) with the units chosen (either PPM or Da) defined above theImage List.
Customise Image Display
Right-clicking anywhere on the image will open the image context menu (shown below). Here you can set the colourmap to use, the pixel size or whether to display a scale bar.
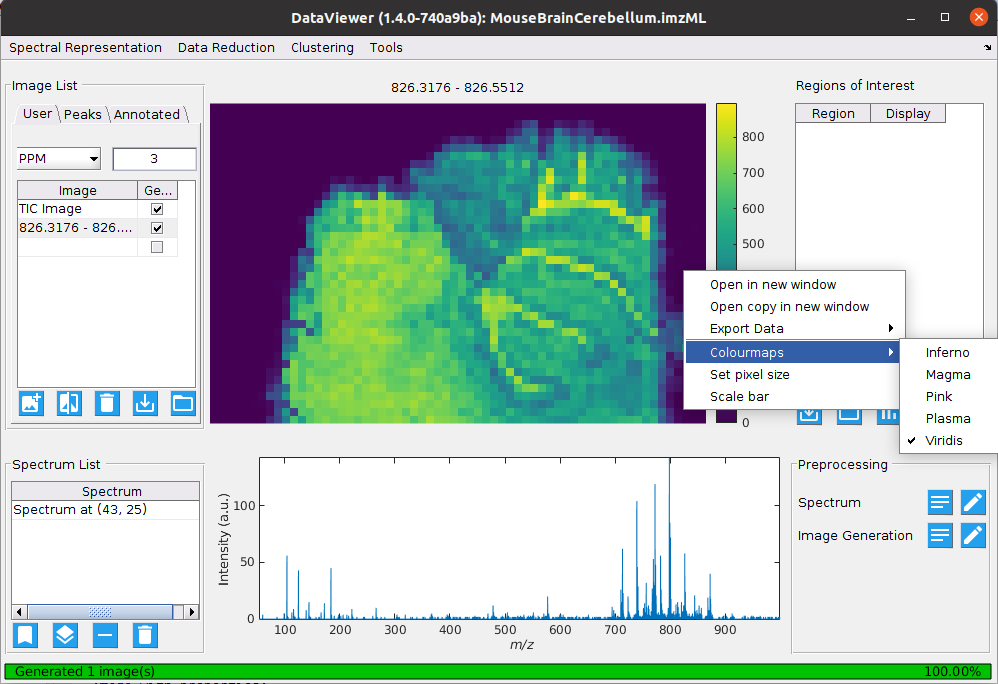
If you set the scale bar to be displayed, but the pixel size information has not been captured, then SpectralAnalysis will request the pixel size of the image before displaying a scale bar.